best satellite for high-resolution earth observation
February 3, 2025
how to calibrate a 3-axis magnetometer for satellite attitude determination
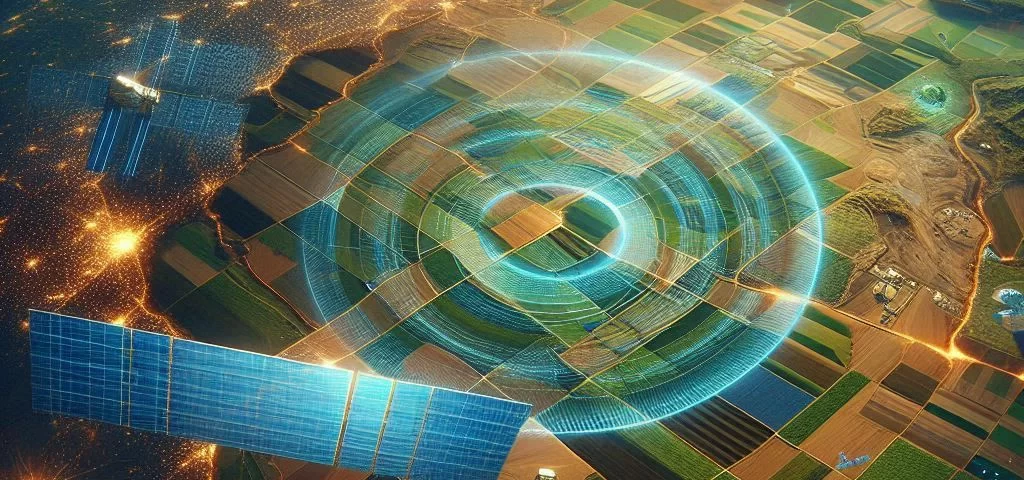
February 9, 2025Feeding the world’s growing population is a huge challenge for agriculture, especially with climate change, limited resources, and changing consumer needs. Precision agriculture, which uses technology like remote sensing, offers a great way to improve farming, boost production, and be more sustainable. Satellite images, especially from groups of satellites like OPTISat, are a valuable source of information for watching and studying agriculture.
What is OPTISat?
OPTISat is a group of small, quick-moving satellites that take pictures of Earth. They’re run by the Italian Space Agency. These satellites take very detailed pictures in many different colors of light, which is helpful for things like farming, watching the environment, and managing disasters. For farming, OPTISat is good because:
- it takes sharp pictures, so you can see individual fields and even differences within them
- it sees light in different colors, which is important for figuring out how healthy plants are
- it visits the same places fairly often, so you can track how crops are growing
- the data is available to people through different ways
Processing OPTISat Data for Agricultural Analysis Guide
-
Data Acquisition and Preprocessing
Getting useful information about agriculture from OPTISat images involves several steps, starting with getting the data and ending with extracting the information you need. First, you download the OPTISat data you want from the provider, specifying the area, time, and colors of light you’re interested in. Then, you need to clean up the data. “Radiometric Calibration” fixes errors caused by the satellite’s sensors. “Atmospheric Correction” removes distortions caused by things like air pollution, so you get a true picture of the ground. There are different ways to do this, depending on the information you have. Finally, “Geometric Correction” fixes distortions caused by the angle of the satellite and the shape of the land, so the image lines up correctly with maps. This is especially important in hilly areas.
-
Image Enhancement and Feature Extraction
Once the image is cleaned up, you can make it easier to understand and pick out important details. “Image Enhancement” is like adjusting the brightness and contrast to make things pop. “Vegetation Indices” are special formulas that use the different colors of light to figure out things like how healthy plants are, how much they’ve grown, and how many leaves they have. NDVI, EVI, and SAVI are some common examples. These indices can help farmers track how their crops are doing, see what stage of growth they’re in, and even guess how much they’ll harvest. Besides these indices, you can also pull out other information, like “texture” (how the image looks patchy or smooth) and “spectral features” (the unique colors that different things reflect).
-
Image Classification and Analysis
Next, you can use “Image Classification” to group the pixels in the image into different categories, like “corn,” “soybeans,” “soil,” or “water.” “Supervised” methods use examples of known areas to teach the computer how to classify the rest of the image. “Unsupervised” methods group pixels based on how similar their colors are, without needing examples. Once the image is classified, you can use it for many things in agriculture: You can map where different crops are growing, track how crops are growing over time and spot problems like lack of water or nutrients, estimate how much of a crop will be harvested, and even create maps to help farmers use the right amount of fertilizer, pesticides, and water in different parts of their fields.
-
Accuracy Assessment and Validation
After classifying the image, you need to check how accurate it is. This means comparing the classified image to what’s actually on the ground, which you might get from visiting fields or other sources. There are different ways to measure accuracy, like “overall accuracy,” “producer’s accuracy,” “user’s accuracy,” and something called the “kappa coefficient.” Finally, you should double-check your results by comparing things like estimated crop area or yield to data from other sources, like government agricultural reports.
Challenges and Opportunities of working with OPTISat data
Working with OPTISat data for farming has some challenges. It can be tricky to remove the effects of the atmosphere, especially when the air isn’t clear. Getting cloud-free images can also be tough, especially at certain times of the year. And processing all that data takes a lot of computer power and special skills. Even with these challenges, OPTISat data offers big opportunities. It can help farmers better manage their crops by knowing when to irrigate, fertilize, and deal with pests. It can also improve food security by helping us track crops and estimate yields. Finally, it can contribute to more sustainable farming by helping farmers use resources more efficiently and reduce their environmental impact.
OPTISatellite data, with its sharp images, ability to see different colors of light, and frequent visits, is really useful for studying agriculture. By processing the data correctly, from getting it and cleaning it up to classifying the images, we can learn a lot to help farmers. As technology gets better, using satellite data in farming will become even more common, leading to better farming methods, more food, and a more sustainable way of growing it.


